Curved Grades
1/11/18
In school at one time or another we've all heard about "grading on the curve". We intuitively know what this means: as a whole students scored badly on an assignment or exam or project for whatever reason, so the instructor will adjust the grades upwards. However, how many of us know how exactly how this is done? In this article I will discuss some methods used to grade on a curve.
Consider the following picture:
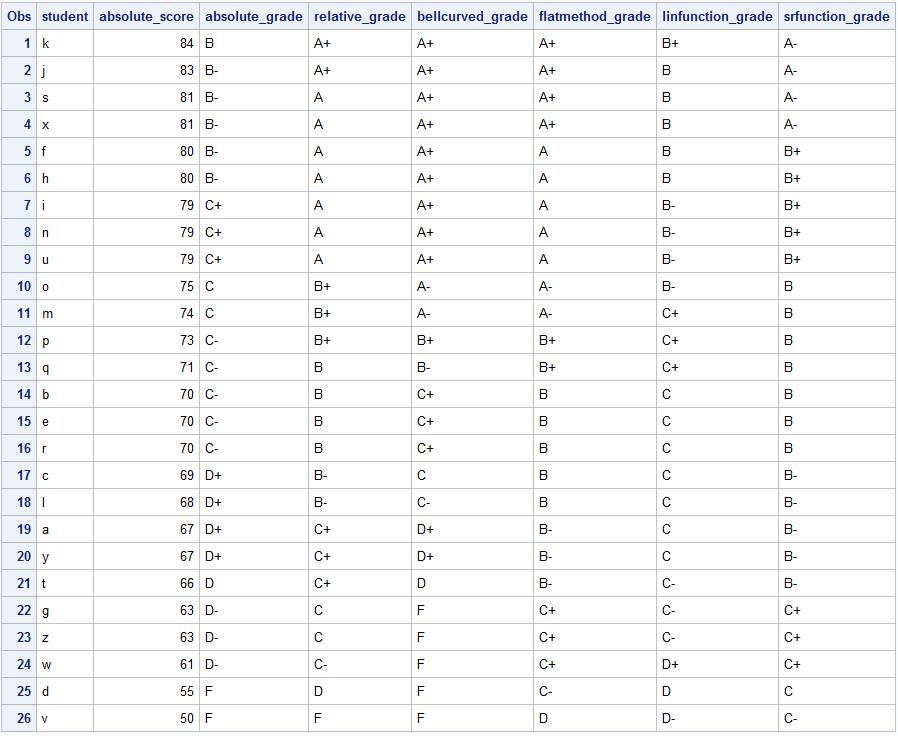
The table shows the unadjusted score "absolute_score", and the grades for 26 students labelled a-z. Their grades were created by the following logic (I did this work using the statistical software SAS):
if absolute_percent <= .60 then absolute_grade='F ';
if .60 < absolute_percent < .633 then absolute_grade='D-';
if .633 <= absolute_percent < .667 then absolute_grade='D ';
if .667 <= absolute_percent < .7 then absolute_grade='D+';
if .7 <= absolute_percent < .733 then absolute_grade='C-';
if .733 <= absolute_percent < .767 then absolute_grade='C ';
if .767 <= absolute_percent < .8 then absolute_grade='C+';
if .8 <= absolute_percent < .833 then absolute_grade='B-';
if .833 <= absolute_percent < .867 then absolute_grade='B ';
if .867 <= absolute_percent < .9 then absolute_grade='B+';
if .9 <= absolute_percent < .933 then absolute_grade='A-';
if .933 <= absolute_percent < .967 then absolute_grade='A ';
if .967 <= absolute_percent then absolute_grade='A+';
One could, of course, just use A-F grades without the "+" and "-" scheme. Something like:
if absolute_percent <= .59 then absolute_grade='F';
if .59 < absolute_percent < .69 then absolute_grade='D';
if .69 <= absolute_percent < .79 then absolute_grade='C';
if .79 <= absolute_percent < .89 then absolute_grade='B';
if .89 <= absolute_percent then absolute_grade='A';
The "relative_grade" curve makes the largest absolute_score 100%, and then other scores are simply calculated as score/largest score.
The next curving method uses the normal distribution (ie. "bell curve"). One can compute the mean of the scores, the standard deviation of the scores, and calculate a z-score like z = 1+(absolute_score-mean)/standard deviation. Note that the "1" in the equation is a shift. One can use other shifts, like .5, for example. Then a student's new grade would be the cumulative distribution function of a standard normal curve from -oo to z.
There is also the "flat method". This is making the largest absolute_score 100% and then other scores get the quantity (100-largest score) added to them. So in our example, the largest score is 84, so each score gets 16 (=100-84) added to them.
One can also use a "linear function". For example, make all scores now (4/5)*absolute_percent+.2. There is another linear way I haven't mentioned, and that is selecting two scores to be certain grades (so the points (absolutescore1, newscore1) and (absolutescore2, newscore2)) and use these points to make a line which is then used as the curve.
One could also use a "square root-like" function. For example, make the scores now 100(1-a)*(absolute_percent)a, where 0 < a < 1. In this example, I used a=.5.
All the methods have pros and cons. Frankly, I think they have more cons (theoretical and societal) than pros. Because of this, I prefer the raw, unadjusted scores. As a teacher, I'd only possibly consider curving at the end of a teaching period for the final grade rather than for individual homework, projects, or exams.
Thanks for reading!
Please anonymously VOTE on the content you have just read:
Like:Dislike: