Mega Millions Lottery Numbers
2/9/16
Mega Millions is one of the most popular lotteries in existence. I thought I'd take a stab at using probability and statistics to look at methods of generating numbers for playing Mega Millions.
As I see it, there are two main ways to create numbers. The first way is completely random. The second way is random, but basing the draws on actual past data.
The dataset I'm using in my R program is of past draws. The b1-b5 are the balls 1 through 5, and the mb is, you guessed it, the Mega Ball. Here
is what the dataset looks like for a few rows:
b1 b2 b3 b4 b5 mb
10 12 21 29 65 10
3 14 15 25 48 8
1 39 52 69 72 1
20 27 38 49 66 2
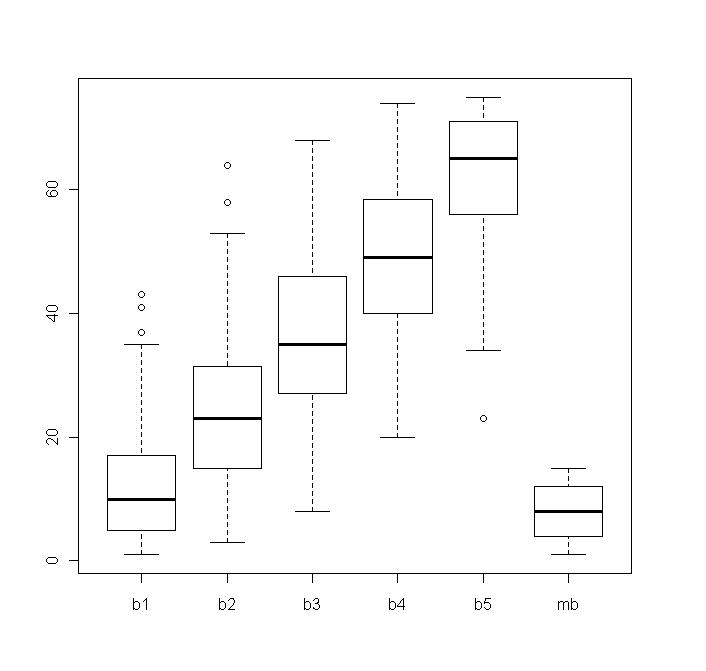
When I run my program, I get two graphs. The first one is a boxplot for each ball
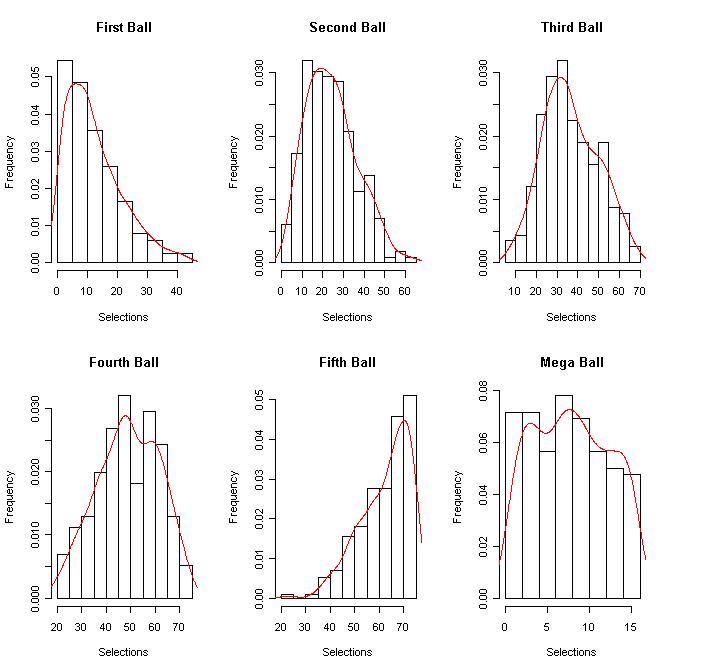
The second graph is a distribution for each ball
Here is my R script with comments:
#program to predict Mega Millions numbers
#for fun
#read in dataset of historical picks
megadata<- read.table("C:/PATHNAMEHERE/winningnumbers.txt",header=T)
attach(megadata)
#print dataset
print(megadata)
#get summary statistics of dataset
summary(megadata)
#boxplots of winning numbers
boxplot(megadata)
#histograms of individual balls
par(mfrow=c(2,3))
hist(b1,prob=T,xlab="Selections",ylab="Frequency",main="First Ball")
lines(density(b1),col="red")
hist(b2,prob=T,xlab="Selections",ylab="Frequency",main="Second Ball")
lines(density(b2),col="red")
hist(b3,prob=T,xlab="Selections",ylab="Frequency",main="Third Ball")
lines(density(b3),col="red")
hist(b4,prob=T,xlab="Selections",ylab="Frequency",main="Fourth Ball")
lines(density(b4),col="red")
hist(b5,prob=T,xlab="Selections",ylab="Frequency",main="Fifth Ball")
lines(density(b5),col="red")
hist(mb,prob=T,xlab="Selections",ylab="Frequency",main="Mega Ball")
lines(density(mb),col="red")
#picks based on actual historic data
k<-100
for (i in 1:k)
{
b1pred<-sample(b1,1)
b2pred<-sample(b2,1)
b3pred<-sample(b3,1)
b4pred<-sample(b4,1)
b5pred<-sample(b5,1)
mbpred<-sample(mb,1)
#sample from winners to predict winners
#b1 < b2 < b3 < b4 < b5, mb is independent (ie. it can duplicate b1-b5 numbers)
if (b1pred < b2pred && b2pred< b3pred && b3pred < b4pred && b4pred < b5pred) print(c(b1pred,b2pred,b3pred,b4pred,b5pred,mbpred))
}
#rules changed to these ~ 10/2013
#picks based on simulated data, not actual data
#b1-b5 from 1-75 without replacement
#mb from 1-15
k<-10
for (i in 1:k)
{
simpicks<-sort(sample(1:75,5,replace=FALSE))
simmb<-sample(1:15,1)
all<-c(simpicks,simmb)
print(all)
}
Will this program make one a millionaire? Probably not. However, it is a great use of probability and statistics to at least try and understand the Mega Millions lottery data.
Note, on 10/2017, the rules changed. The 5 white balls are now from 1 to 70, and the Mega Ball is from 1 to 25. In my "live" code I have made the appropriate changes.
Thanks for reading.
Please anonymously VOTE on the content you have just read:
Like:Dislike: