Predictive Stats vs P-values
7/9/21
In Briggs' How Predictive Statistics Can Help Alleviate, But Not Eliminate, The Reproducibility Crisis he makes the grandiose claim that "Predictive statistics can help alleviate the Reproducibility Crisis by, in a word, eliminating p-values. And replacing them with superior measures more useful in quantifying the uncertainty present." However, nothing he shows in the Briggsian analysis in that article is evidence for such a claim.
To summarize, he created some X and Y randomly, runs a linear regression, and selects those occurrences with p-value < α. Then, since X was created to be unrelated to Y, concludes that cases with p < α are demonstrations of flaws with p-values, because "there is nothing in x that says anything about y", and that the predictive approach showing P(X > Y) ~ 50% here is correct and more informative.
An aside is, note the contradictory narratives used against standard statistical practice. There is a "replication crisis" because small p-values are not seen from trial to trial. At the same time, small p-values are obviously very easy to find. But back to the article.
Note, here Briggs claims that "If you are picking numbers from a "normal", or any "distribution", the chance the second one is larger than the first is 50%." which I have no disagreement with. This is because, assuming continuous X and Y, P(X = Y) = 0, and P(X > Y) + P(X < Y) = 1, which is the same as 2*P(X > Y) = 1, so P(X > Y) = 1/2, if you are selecting from the same distribution. Of course, this is in the population. The calculation of P(X > Y) for our samples, however, will be approximately 50%.
Here are the graphs Briggs created:
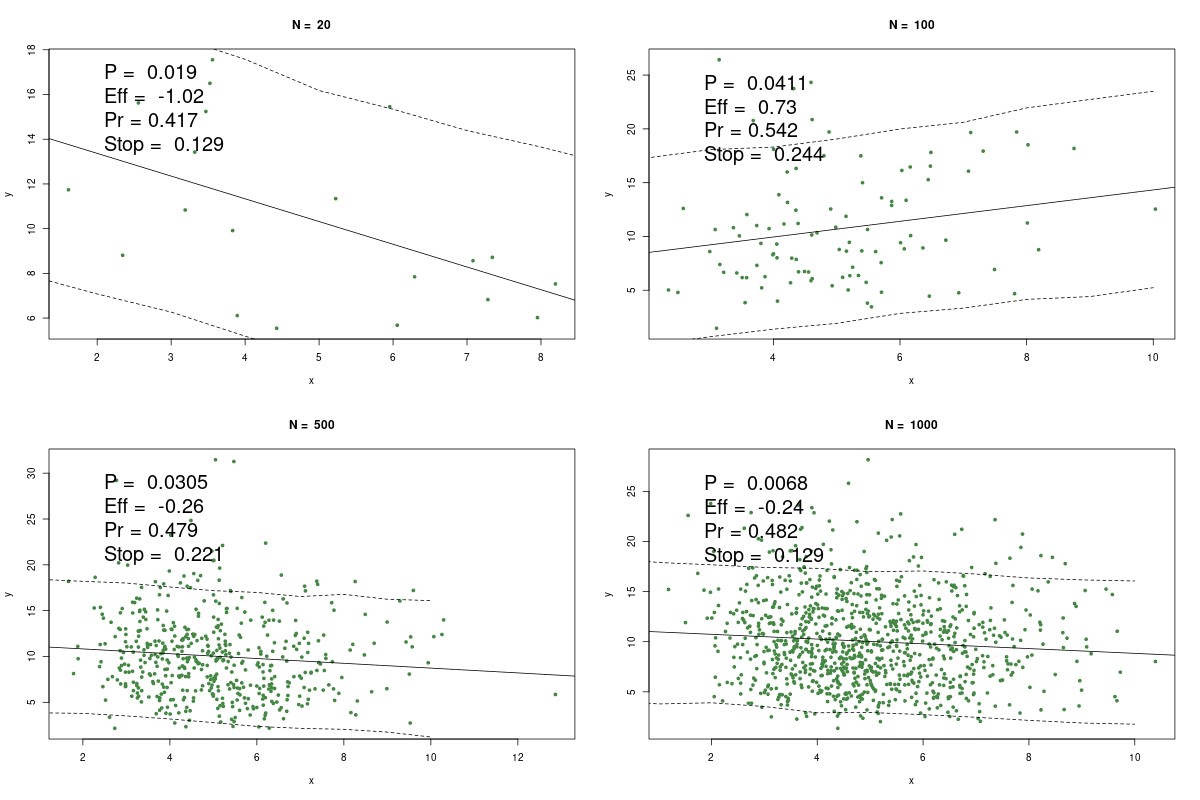
Instead of finding some fatal flaw in p-values, what Briggs has actually done is engage in selection effects, gaming, and QRPs ("questionable research practices"). Note, that such things can be done for any procedure (frequentist, Bayesian, or Briggsian). An example is that he selected X and Y to be completely unrelated. In real life, they'd come from a well-designed experiment or survey, where p-value < α would be more meaningful. So showing a simulation of what people do not do is a bit puzzling. Note that here X and Y are unrelated in the population, but a sample is taken and in real life we hardly ever know the population exactly (if we did, we probably wouldn't need any statistics). Briggs can see this if he makes n large. You get a cloud of points that will give an estimate of the population slope of about 0. What is also interesting, is that he doesn't mention the need for checking assumptions for doing linear regression. These assumptions should obviously be checked in practice, but such checks are clearly not in his code. If assumptions for linear regression are not checked, that is more QRPs.
Moreover, in his demonstration, he relies on probability and statistics concepts that he has critiqued as nonsensical in articles. He clearly uses parameters in the gammas and negative binomial. He calls "Pr = a/(m-1)" a "probability", which is interesting, given his rejection of frequency notions of probability, as this is just the frequency of occurrences where X > Y, divided by the total observations. Also, the call to Stan runs a MCMC, which relies on frequentist sampling and convergence notions, and, gasp, parameters (the Stan manual verifies this). The fact that Briggs says PRNGs used in MCMC are not truly random is of course true, but irrelevant, since we cannot predict outcomes from PRNGs with certainty. Briggs even has an article arguing against the trend as a model, which is exactly what a linear regression gives. Also, by acknowledging things like P(X > Y) = 1/2, and β1 = 0 means no effect, he is in fact acknowledging parameters make sense.
In fact, Briggs manages here to demonstrate the effectiveness of literally everything he tries to argue against: p-values, parameters, models, relative frequencies, sampling, convergence, PRNGs, and Bayesian methods. Pro tip: if you are arguing against X, do not rely on X (in a positive manner) in your argument. It is self-defeating.
Of course, running his simulation produces exactly what one would expect with p-values and α and hypothesis tests; they are going to erroneously reject H0: β1 = 0 approximately α of the time. This is not a bad thing; this is exactly what they are designed to do, to evaluate the distance what you observe is from what you expect, given a model and allowing for errors. He does not show any times where p-value > α. If he did, he'd see times where the p-value "gets it right" by being aligned with his predictive approach.
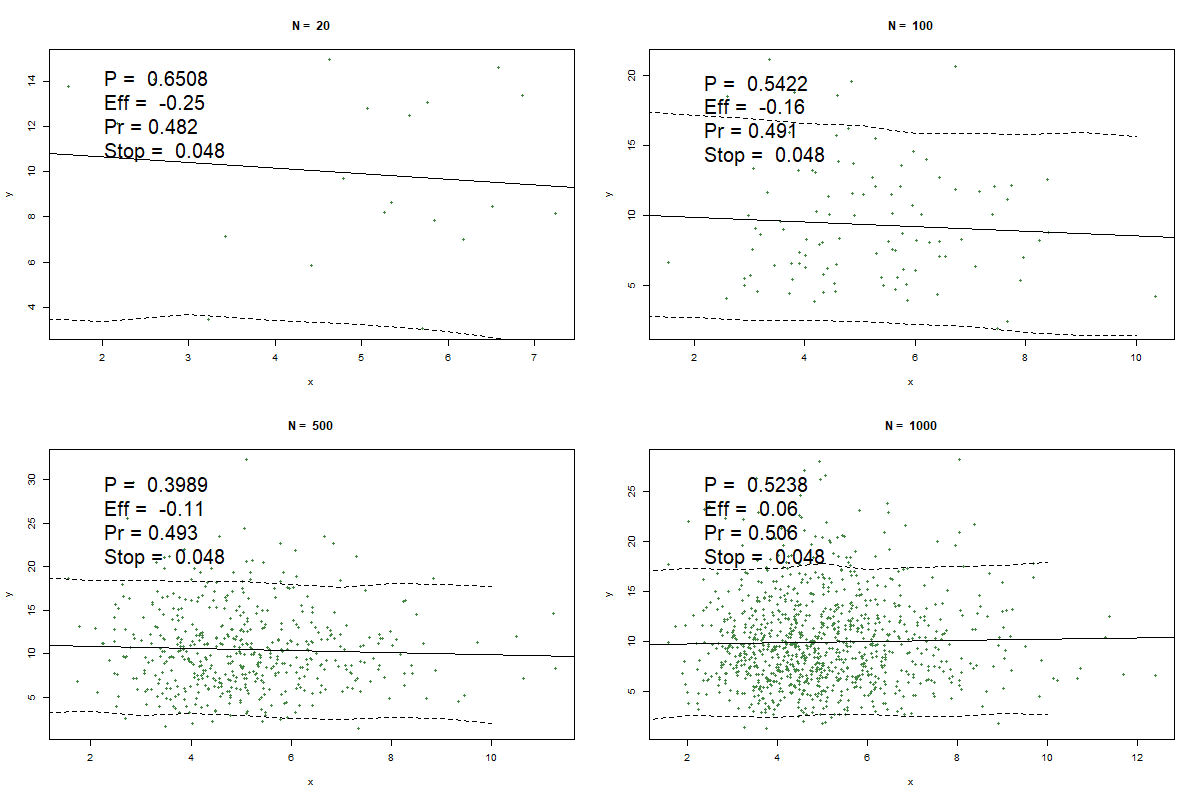
First, let's look at some cases with p-value > α that I created by modifying his code:
Second, I let n be large, so we can see the entire population from which we are sampling:
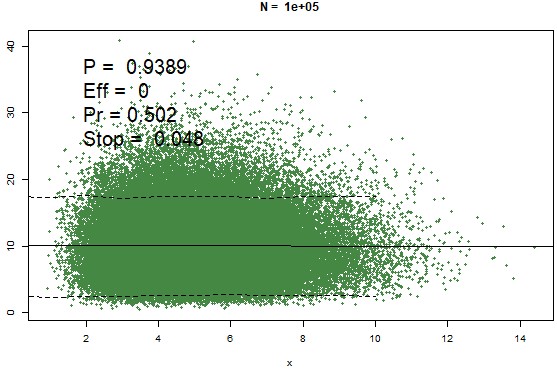
Does this look like something we should be doing a linear regression on in the first place? Note that the p-values nails it here as n gets larger: there is clearly no relation between X and Y in the population. Note that the n here, 105 = 100,000, is still less than "infinity", which is what Briggs claims is needed (which is also not true).
A statistician would also not just produce a p-value, but also standard errors, confidence intervals, and look at practical significance, such as the smallest effect size of interest via equivalence testing, and do preregistration of analyses. Not providing these things is, yes, more QRPs.
Briggs mentions the p-value < α (for example, .05) as being a common journal standard for possible acceptance of a paper as a criticism. First, papers should be accepted for many reasons, not just p-values (whether small or large compared to α). A journal having any standard is to help keep out crud and hand-waving arguments. Frankly, I am not impressed by the argument that a journal's decision on standards mean the mathematics behind statistical tests is flawed. Second, what does Briggs' P(X > Y) need to be for possible acceptance of a paper? What is the distribution of this difference and for what values away from 50% is this interesting (dare I say, significant)? Why in these regression settings doesn't the scientific world focus on this measure? He doesn't say.
Last, standard frequentism (or Bayesian) methods already do prediction. That is one of the main purposes of time series or a regression and various prediction bands, either for predicting a mean Y for a value of X or predicting a single Y for a value of X.
Briggs is way late to the party on prediction. For example, Karl Pearson, in 1920, has a paper on "The Fundamental problem of practical statistics", in which he asks
An "event" has occurred a times out of a + b = n trials, where we have no a priori knowledge of the frequency of the event in the total population of occurrences. What is the probability of its occurring c times in a further c + d = m trials?
It also must be noted, that statistics has many possible goals, and prediction is only one thing that we might be interested in doing with statistics.
Thanks for reading.
Please anonymously VOTE on the content you have just read:
Like:Dislike: